Vector Quantization
کمی سازی برداری یا رقمی سازی برداری
همانطور که می دانیم تنوع رنگ در طبیعت بسیار زیاد است.اما هنگام تصویر گرفتن از طبیعت و مشاهده تصویر گرفته شده با دوربین یا موبایل و ... میبینیم که از برخی از رنگها صرف نظر شده است (کاهش تعداد پیکسلهای رنگی)،
همچنین باذخیره کردن تصویر به روی کامپیوتر،متوجه می شویم که تعداد پیکسلها کاهش یافته است، یا پیکسلهای مشابه ادغام می شوند و یا پیکسلهای مشابه به روی سیستم ثبت نمی شوند.
یکی از پرکاربردترین متدها به منظور فشرده سازی تصاویر، VQ می باشد.
پیکلسلهای تصویر را میتوان در قالب بلوکهای n*n در نظر گرفت. پیکسلها در هر بلوک به صورت سطر به سطر مرتب شده اند. VQ روشی است بر پایه متد خوشه بندی،یعنی گروه بندی کردن بردارهای (بلوک) مشابه در داخل یک کلاس. بردارها از دل داده هایی که از تصویراستخراج شده اند و به شکل بلوکهای n*n هستند بدست می آیند(مثلا 4*4).
روند فشرده سازی تصویر با VQ در سه فاز انجام می شود:
-تولید کدبوک -کدکردن (رمز گذاری) -دکد کردن (رمز گشایی)
در فاز اول یعنی تولید کدبوک ، از قبل مجموعه ای از کلمه هایی کد شده مبتنی بر بردارهای آموزشی تصویری تولید شده اند.
هدف اصلی ،پیداکردن مجموعه ای از نمایندگان از کلمه کدهاست تا از طریق نمایندگان بتوان تصویری با کمترین تحریف بعد از فشرده سازی ایجاد کرد.(انتخاب زیرمجموعه ای از کلمه کدها بعنوان نماینده)
با فشرده سازی تصویر ،رمز گذار( encoder ) ،آدرسی از کلمه کدها ایجاد میکند که به بردار تصویر ورودی نزدیک باشد. و رمز گشا(decoder) از این درسها برای بازیابی بردار تصویر استفاده میکند.
کتاب کد ،یک عامل کلیدی تاثیر گذار به روی کارایی فرایند فشرده سازی تصویر می باشد.
برای
تولید کدبوک الگوریتمهایی ارائه شده اند. مانند kmeans و LBG . الگوریتم LBG بر پایه تکرار است که مجموعه ای از کلمه کدهای نماینده را تولید
می کند تا میزان تحریف و اعوجاج را در طول بردارهای آموزشی کاهش دهد و به
حداقل رساند. این فرایند تولید کلمه کد،محاسبات فشرده ای دارد و برحسب
انتخاب اولیه کلمه کد، نرخ اعوجاج ،تحت تاثیرقرار میگیرد. و ممکن است در
انتها کدبوکی کمتر از حد مطلوب بدست آید.
تعداد وکتورهای آموزشی را با M و تعداد کلمه کدها رابا N نشان میدهیم.
مساله طراحی کدبوک می تواند به عنوان یک مساله خوشه بندی فرموله شود که M بر N تقسیم می شو د که خود یک مساله NP-hard است.برای M و N های بزرگ، یک الگوریتم جستجوی سنتی مانند LBG به سختی میتواند طبقه بندی بهینه کلی را بیابد.
Vector Quantization
This page contains information related to vector quantization (VQ). Currently this page includes information about VQ with regards to compression. In the future, we will make this page a more comprehensive VQ page.
In what applications is VQ used?
Vector quantization is used in many applications such as image and voice compression, voice recognition (in general statistical pattern recognition), and surprisingly enough in volume rendering (I have no idea how VQ is used in volume rendering!).
What is VQ?
A vector quantizer maps k-dimensional vectors in the vector space Rk into a finite set of vectors Y = {yi: i = 1, 2, ..., N}. Each vector yi is called a code vector or a codeword. and the set of all the codewords is called a codebook. Associated with each codeword, yi, is a nearest neighbor region called Voronoi region, and it is defined by:

The set of Voronoi regions partition the entire space Rk such that:

 for all i
 j
j |
| Figure 1: Codewords in 2-dimensional space. Input vectors are marked with an x, codewords are marked with red circles, and the Voronoi regions are separated with boundary lines. |
The representative codeword is determined to be the closest in Euclidean distance from the input vector. The Euclidean distance is defined by:
where xj is the jth component of the input vector, and yij is the jth is component of the codeword yi.
How does VQ work in compression?
 |
| Figure 2: The Encoder and decoder in a vector quantizer. Given an input vector, the closest codeword is found and the index of the codeword is sent through the channel. The decoder receives the index of the codeword, and outputs the codeword. |
How is the codebook designed?
So far we have talked about the way VQ works, but we haven't talked about how to generate the codebook. What code words best represent a given set of input vectors? How many should be chosen?
The algorithm
- Determine the number of codewords, N, or the size of the codebook.
- Select N codewords at random, and let that be the initial codebook. The initial codewords can be randomly chosen from the set of input vectors.
- Using the Euclidean distance measure clusterize the vectors around each codeword. This is done by taking each input vector and finding the Euclidean distance between it and each codeword. The input vector belongs to the cluster of the codeword that yields the minimum distance.
- Compute the new set of codewords. This is done by obtaining the average of each cluster. Add the component of each vector and divide by the number of vectors in the cluster.
- Repeat steps 2 and 3 until the either the codewords don't change or the change in the codewords is small.
There are many other methods to designing the codebook, methods such as Pairwise Nearest Neighbor (PNN), Simulated Annealing, Maximum Descent (MD), and Frequency-Sensitive Competitive Learning (FSCL), etc.
How does the search engine work?
Although VQ offers more compression for the same distortion rate as scalar quantization and PCM, yet is not as widely implemented. This due to two things. The first is the time it takes to generate the codebook, and second is the speed of the search. Many algorithms have be proposed to increase the speed of the search. Some of them reduce the math used to determine the codeword that offers the minimum distortion, other algorithms preprocess the codewords and exploit underlying structure.
The simplest search method, which is also the slowest, is full search. In full search an input vector is compared with every codeword in the codebook. If there were M input vectors, N codewords, and each vector is in k dimensions, then the number of multiplies becomes kMN, the number of additions and subtractions become MN((k - 1) + k) = MN(2k-1), and the number of comparisons becomes MN(k - 1). This makes full search an expensive method.
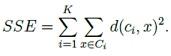
What is the measure of performance VQ?
How does one rate the performance of a compressed image or sound using VQ? There is no good way to measure the performance of VQ. This is because the distortion that VQ incurs will be evaluated by us humans and that is a subjective measure. Don't despair! We can always resort to good old Mean Squared Error (MSE) and Peak Signal to Noise Ratio (PSNR). MSE is defined as follows:
where M is the number of elements in the signal, or image. For example, if we wanted to find the MSE between the reconstructed and the original image, then we would take the difference between the two images pixel by pixel, square the results, and average the results.
The PSNR is defined as follows:
where n is the number of bits per symbol. As an example, if we want to find the PSNR between two 256 gray level images, then we set n to 8 bits.
الگوریتم Kmeans
الگوریتم های کلاسترینگ
خوشه بندی و یا آنالیز خوشه ای ، گروهی از اشیا داده ای که تنها براساس اطلاعات به دست آمده از داده ها کار می کند که به توصیف اشیاارتباط بین آنها می پردازد.هدف این است که اشیا درون یک گروه شبیه باشند و اشیا درون گروه های مختلف متفاوت باشند.
کیفیت خوشه ها بر اساس تمایز بین گروه ها و همسان بودن درونی گروه ها تعیین می شود. در دامنه ای از تصاویر این توصیف کلی به فاصله پیکسل ها در فضای رنگی تفسیر می شود پیکسل هایی که در کنار یکدیگر در یک کلاستر می باشند.
Kmeans
یک الگوریتم تکرار شونده است که تعداد کلاستر ها را قبل از اجرا تعیین می کند. در ابتدا مرکز حجم K به وسیله قوانینی تعیین می شود.(در ابتدا به صورت تصادفی با استفاده از نقاط داده ) و آنها وزن مرکز کلاستر را تعیین می کنند
برای هر نقطه داده یک مرکز حجم محاسبه می شود. در نتیجه کلاستری هایی از نقاط تشکیل می شود و در مرحله بعد تمام نقاط به کلاستر ها می پیوندند این روند ادامه پیدا می کند تا شرط پایان برسد.
در این روش ، در ابتدا تعداد خوشه ها مشخص می شود (K) و برای هرخوشه ، یک
نمونه داده از بین داده های موجود ، بعنوان هسته خوشه (مرکز خوشه) در نظر
گرفته می شود.
با توجه به اینکه در این روش ،از ابتدا تعداد خوشه ها مشخص شده است و خوشهبندی K-Means به انتخاب اولیه خوشهها بستگی دارد، نتایج خوشه بندی در حین تکرار الگوریتم ، متفاوت می شود.
Algorithm 1 Basic K-means algorithm
1- انتخاب K نقطه به عنوان مرکز حجم های اولیه به صورت تصادفی
تکرار
2- اضافه کردن نقاط به نزدیک ترین مرکز حجم از کلاستر های K
3- محاسبه مجدد حجم هر کلاستر
پایان زمانی که شرط پایان برسد و دیگر تغییری در مراکز حجم ها به وجود نیاید
برای محاسبه فاصله مرکز حجم c تا نقطه x از رابطه زیر استفاده می کنیم
ِ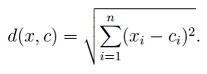
-شرایط پایان الگوریتم
دستیابی به حداکثر تعداد تکرار ها
مرکز حجم ها کمینه شود(Local or Global)- تغییر زیادی در محل حجم ها به وجود نیاید.

c' مرکز حجم به روز شده c و d مقدار جابه جایی که کمتر یا مساوی ازr حداکثر جابه جایی است
در کلاستر بندی تصاویر شرط خاتمه دوم استفاده می شود
پیچیدگی K means از نوع NP-Hard می باشد